This page discusses impedance in greater detail. If you are unfamiliar with impedance learn more here. (Tip: On this page, hold the cursor over terms appearing in italics for further details.)
Complex Impedance:
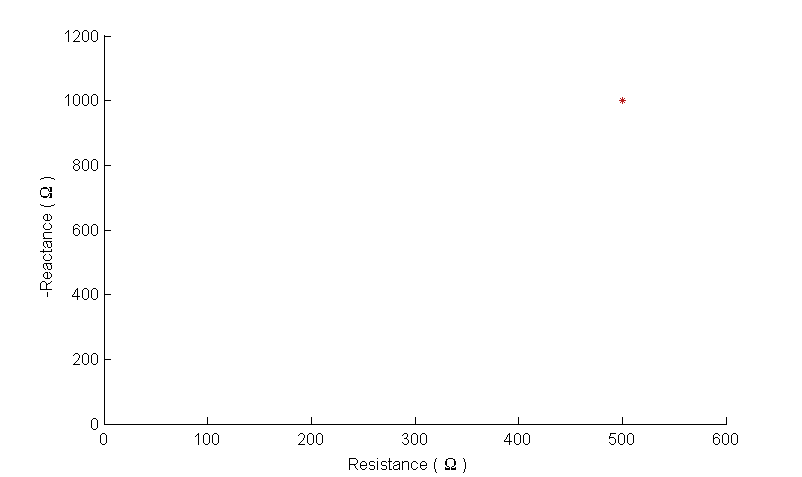
Impedance (Z) is a measure of the complete opposition to current flow including both resistance (R) and reactance (X). It is written as Z = R + jX and is displayed using a co-ordinate system of these two components in just the same way that we define our position as being a certain (longitude, latitude) or a point might appear on a graph with (x,y) coordinates. For bioimpedance, the coordinates are (resistance, -reactance). Below is an example:

This plot represents an impedance that is comprised of a resistance of 500Ω and a capacitive reactance of 1000Ω
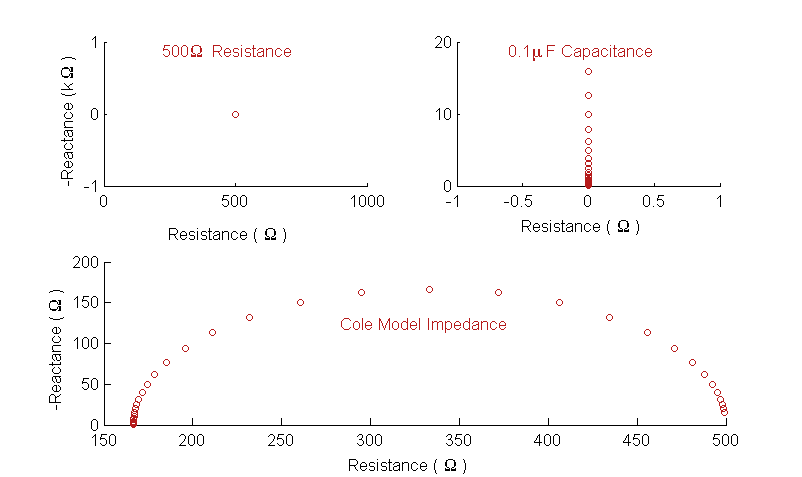
This impedance is valid for a particular frequency but it is often the case that we measure impedance over a range of frequencies. The value obtained at each frequency is added to the plot to display the frequency dependence of the impedance. Below are some further plots which illustrate this:

The upper row of impedance profiles shows a resistance (left) and a capacitive reactance (right). The lower row shows a typical impedance profile expected of tissue, termed the Cole Model.
If the object under investigation was purely resistive then the impedance would not change with frequency as shown in the plot on the top left. In all of the plots, the frequency range (or bandwidth) is from 100Hz to 10MHz but only a single point is identified on the impedance plot because the impedance is constant and purely resistive across all frequencies. In this example it has a resistance of 500Ω and a reactance of 0Ω, i.e. Z = 500 + j0 Ω. On the top right is the impedance of a purely capacitive reactance. In this case there is a spread of values because reactance is frequency dependent. On the horizontal axis it can be seen that the resistance is zero. In this case the impedance is Z = 0 – j/(ωC) Ω. The plot on the lower row of this figure shows the impedance profile that can be expected from tissue. Here both the resistance and the reactance that are measured are dependent on the frequency used because there are multiple pathways (in this case intracellular or extracellular routes) available for current flow. This model is explained in greater detail in the bioimpedance section.
